
Figure 1. ACh-induced hyperpolarization and endothelial cells in the guinea-pig coronary artery.
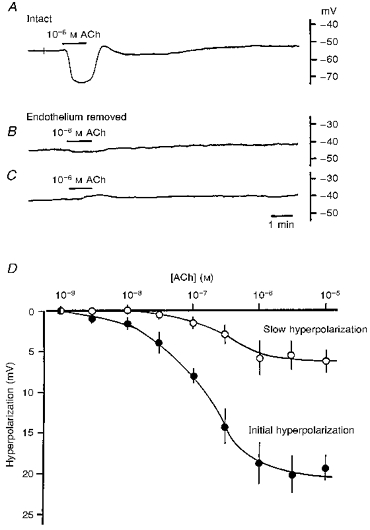
ACh (10−6 M) was applied for 1 min as indicated by the horizontal bars. Endothelial cells were either intact (A) or damaged with distilled water (B and C). Each response was recorded from a different vessel. D, relationship between the concentration of ACh and the amplitude of the hyperpolarization. ACh (10−9-10−5 M) was applied for 1 min and the peak amplitudes of the initial (•) and slow (^) hyperpolarizations were measured. Means ±s.d. (n = 5–18 observations) obtained from 5 arteries.