
Figure 5. Repetitive stimulation elicited hot spots in the same places.
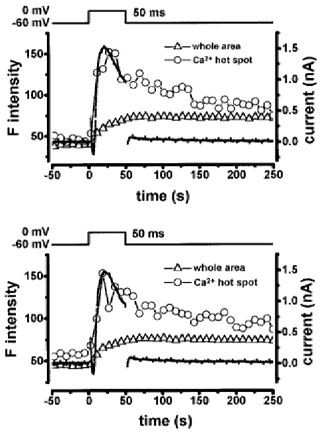
Two sets of recordings of F intensity and membrane currents obtained by two sequential depolarizations at an interval of 30 s. A urinary bladder myocyte was depolarized from -60 to 0 mV for 50 ms. Three subplasmalemmal hot spots were elicited in the confocal plane within the first 20 ms of depolarization. The time course of F intensity indicated by open circles was measured from the most clear hot spot, which was located just beneath the plasma membrane (< 1 μm) in the middle part of the cell. A circle (1.2 μm in diameter) was placed on the hot spot and the averaged F intensity was measured. The triangles indicate the averaged F intensity of the whole cell area. The dotted line indicates the membrane currents. Note that the time courses of F intensity in the hot spot and IK,Ca were comparable in the two sets of recordings.