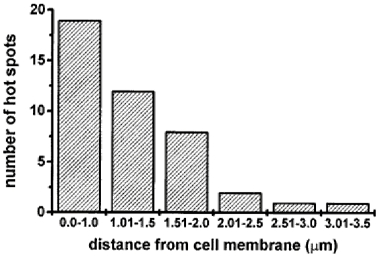
Figure 6. Location of hot spots from the cell edge.

The number of hot spots observed within 20 ms of the step from -60 to 0 mV is shown against the distance between the centre of the hot spots and the closest part of the plasma membrane. The distance was measured from the profile of each hot spot as shown in Fig. 4D.
