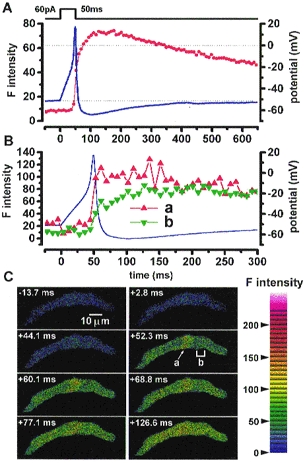
Figure 9. Ca2+ images during an action potential in a vas deferens myocyte.

A, an action potential (blue line) was elicited by a current injection of 60 pA through the recording pipette under current clamp mode. The resting membrane potential, the peak of overshoot and after-hyperpolarization were -52, 18 and -66 mV, respectively. The F intensity over the whole cell area is indicated by red circles. The maximum rate of increase in F intensity was observed when action potential repolarization started. The peaks of after-hyperpolarization and F intensity were obtained approximately 50 and 100 ms after the action potential peaks, respectively. B, the action potential in A shown on a faster time scale with the F intensity at a Ca2+ hot spot (red triangles) and in a subplasmalemma area (green triangles) shown at a and b, respectively, in C (+52.3 ms). The F intensities in the hot spot ‘a’ and in the area ‘b’ were measured respectively in a circular spot (1.2 μm in diameter) and in four similar spots placed side by side. Note that Ca2+ hot spots appeared just before the upstroke of the action potential at a potential of approximately -20 mV. C, eight Ca2+ images were obtained at the times indicated, during an evoked action potential; note that as under voltage clamp, [Ca2+] rises first in hot spots, which then spread through the cell.
