
Figure 1. Scatchard plots of transport-specific 5-[3H]HT binding to intact L-S1 cells.
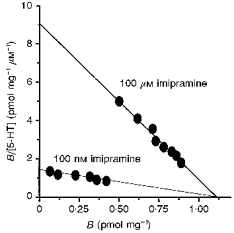
The concentration of 5-[3H]HT ranged from 0.1 to 0.5 μm. Specific binding levels (‘B’) were measured as displacement of total binding by either 100 nm (near the IC50 value) or 100 μm imipramine (fully inhibitory concentration). Each point is the mean of six measurements.