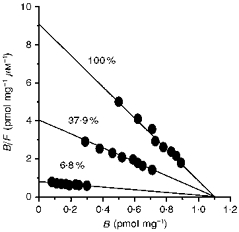
Figure 4. Scatchard plots of specific 5-[3H]HT binding with varying [Cl−]o.

Using isethionate substitution, [Cl−]o at 6.8 % (9.4 mm), 37.9 % (52.1 mm) and 100 % (137.4 mm) were used for quantifying specific binding at 5-[3H]HT concentrations ranging from 0.1 to 0.5 μm. Non-specific binding levels were assessed using 100 μm imipramine. Each point is the mean of six measurements.
