
Figure 1. Dose-response relationship between chemoreceptor activity and reductions in extra.
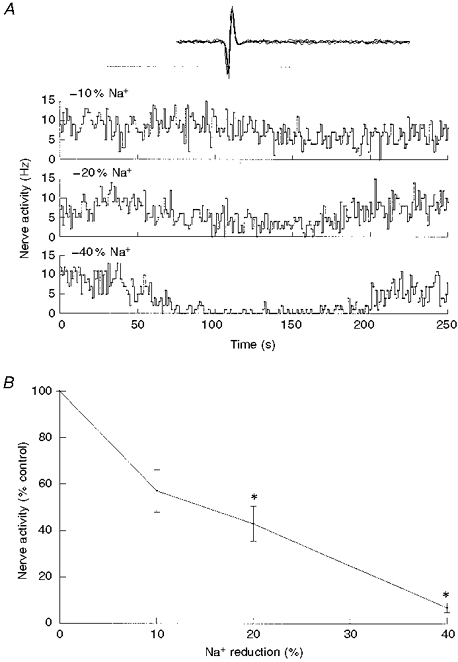
cellular Na+ concentrationA, single-fibre nerve activity before, during and following a 2 min perfusion with reduced Na+ saline, indicated by the bar. Top trace, isosmotic switching from 140 to 126 mM Na+o; middle, 140 to 112 mM Na+o; bottom, 140 to 84 mM Na+o. Inset (here and in subsequent figures), oscillographic tracing of superimposed action potentials triggered by the discriminator output. Total sweep was 10 ms. B, single-fibre nerve activity and activity at the end of switching to reduced Na+ saline (means ±s.e.m.), expressed as a percentage of control discharge frequency. Spiking activity was significantly reduced (*P < 0.05) during 20 and 40 % reductions in [Na+]o (n = 5).