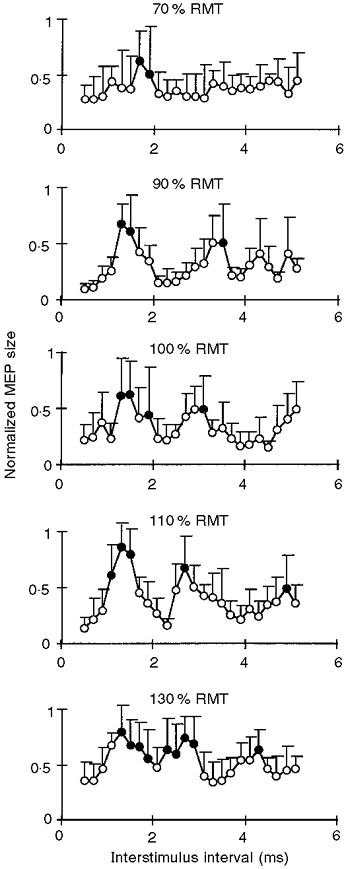
Figure 2. Motor-evoked potential facilitation by paired transcranial magnetic stimulation as a function of the intensity of the first stimulus.

Averaged motor responses in the relaxed ADM of 6 subjects are plotted against the interstimulus interval at different intensities of the first stimulus (indicated at the top of each panel; RMT, resting motor threshold). Error bars indicate standard deviation. The intensity of the second stimulus was fixed at 90 % of RMT. MEP size was normalized for a given subject and a given session to the maximum MEP, which was assigned a value of 1. • denotes MEPs which were not significantly different from 1 (P > 0.05, Bonferroni-corrected multiple t tests).
