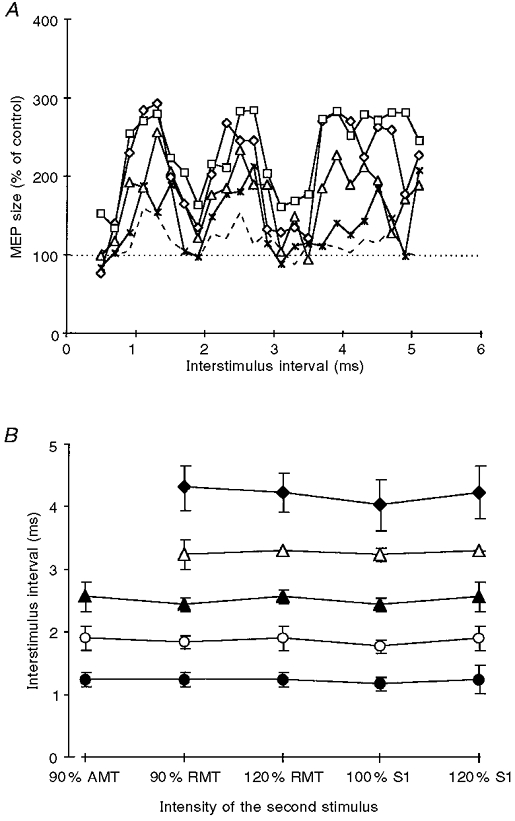
Figure 3. Motor-evoked potential facilitation by paired transcranial magnetic stimulation as a function of the intensity of the second stimulus.

A, averaged motor responses in the relaxed ADM of 3 subjects are plotted against the interstimulus interval. MEP size after paired stimulation is expressed as a percentage of the control MEP to the first stimulus alone. The intensity of the first stimulus was fixed to produce a MEP of 1 mV; the intensity of the second stimulus was 90 % of active motor threshold (AMT, dashed line), 90 % of resting motor threshold (RMT, ×), 120 % of resting motor threshold (▵), the same intensity as the first stimulus (⋄), or 120 % of the first stimulus (□). The horizontal dotted line indicates the 100 % level (i.e. no effect by the second stimulus). B, averaged (3 subjects) interstimulus intervals where the centre of the 3 MEP peaks (P1, P2 and P3, denoted as •, ▴ and ♦, respectively) and the centre of the two troughs (T1 and T2, denoted as ○ and ▵, respectively) occurred. Centres were defined as the central interval out of those 3 neighbouring interstimulus intervals providing maximum (for peaks) or minimum (for troughs) sums of MEP values. Data are plotted against the intensity of the second stimulus. Error bars are standard deviations. For T2 and P3 no values are given for the lowest intensity of the second stimulus, since it was not clearly distinguishable in the single subjects.
