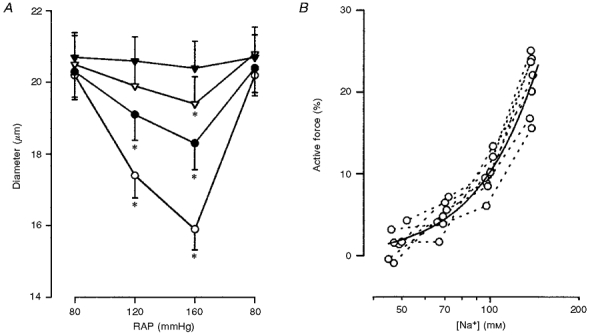
A, impact of lowering extracellular sodium concentration on afferent arteriolar myogenic constriction. ○, •, ▿ and ▾ represent 140, 100, 70 and 50 m
m sodium in the media, respectively. * Significant difference from respective basal value at 80 m
mHg.
B, effects of varing extracellular sodium concentrations on afferent arteriolar active force development at a renal arterial pressure of 160 m
mHg. Active arteriolar force was calculated from changes in diameters, and is expressed as percentage changes from passive tension of each arteriole at 160 m
mHg. Data from single afferent arterioles are connected with dotted lines. Continuous line indicates the best-fitting curve for a total of 28 data points obtained using regression analysis:
(tolerance < 0.0001), where [Na
+] indicates extracellular sodium concentration.


