
Figure 1. Antisense oligonucleotide uptake.
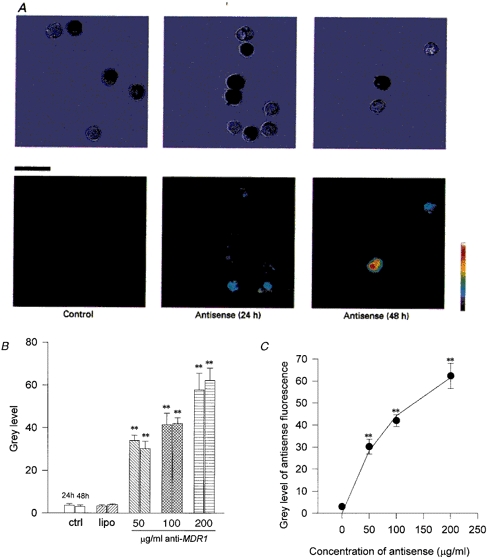
A, uptake of fluorescently labelled anti-human MDR1 antisense oligonucleotides. The upper row are light micrographs of the same images as the laser scanning confocal microscope images in the lower row. Pigmented and non-pigmented ciliary epithelial cells were incubated in control solution and for 24 and 48 h at 37 °C in antisense oligonucleotide against human MDR1 with the transfecting agent lipofectin (20 μg ml−1). Scale bar, 20 μm. Note the increase in uptake (fluorescence) particularly in the non-pigmented cells after 48 h. B, there was no significant difference in the fluorescence between control (ctrl, n= 7 cells) and lipofectin alone (lipo, 20 μg ml−1, n= 14), or antisense oligonucleotide alone at 100 or 200 μg ml−1, or antisense oligonucleotide and hypotonic solution (data not shown). However, at 50, 100 and 200 μg ml−1 antisense oligonucleotide with 20 μg ml−1 lipofectin there was a significantly increased fluorescence signal. The grey level value increased from 3.6 ± 0.7 units (24 h; n= 7) and 3.1 ± 0.7 units (48 h; n= 20) in control to 57.7 ± 7.9 units (24 h; n= 23) and 62.3 ± 5.7 units (48 h; n= 29) in 200 μg ml−1 antisense oligonucleotide with lipofectin (** P < 0.01). C, uptake of antisense oligonucleotide vs. external concentration. The uptake of fluorescently labelled antisense oligonucleotide after 48 h incubation in different concentrations of anti-human MDR1. The fluorescence was quantified using confocal microscopy and is represented as a grey level (0 = black, 255 = white). The graph shows a hyperbolic relationship between grey level and concentration suggesting that the cytoplasmic levels of antisense oligonucleotide are proportional to the external levels. The continuous line represents the fit of a Michaelis-Menten-type equation (y = Vmax[antisense oligonucleotide]/(Km+[antisense oligonucleotide])) to the data with Vmax= 101 grey level units and Km= 128 μg ml−1 (** P < 0.01 vs. control).