
Figure 5. Latency of activation of hypotonic-induced current.
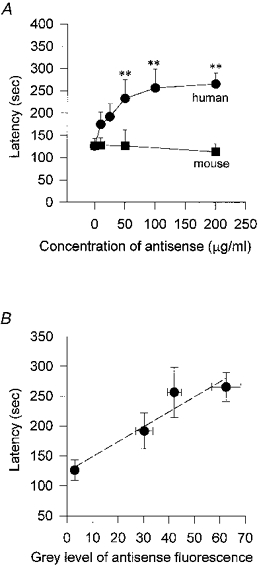
The latency was defined as the time taken for the whole-cell current to activate following exposure to hypotonic solution. In cells which had been incubated in anti-mouse mdr antisense oligonucleotide (▪) for 48 h there was no significant increase in the latency of activation; control latency was 124 ± 29 s (no additives; n= 11 cells) and 126 ± 17 s (lipofectin alone, 20 μg ml−1, n= 29) compared with 113 ± 19 s (n= 6) in 200 μg ml−1 anti-mouse mdr. On the other hand anti-human MDR1 (•) caused a progressive increase in latency with increasing concentrations, doubling the latency to 265 ± 25 s (n= 27) at a concentration of 200 μg ml−1 (** P < 0.01). B, latency of activation vs. antisense oligonucleotide uptake. The latency following hypotonic activation was measured for cells exposed to lipofectin alone (control), and lipofectin with 50, 100 and 200 μg ml−1 anti-human MDR1 for 48 h and these values are compared with the degree of fluorescence (measured by confocal microscopy, see legend to Fig. 1C) exhibited by cells exposed to the same treatment regime. There is a linear relationship between fluorescence and latency indicating that the more antisense oligonucleotide that enters the cell the greater the delay in the latency of activation of the hypotonic-activated current. The dashed line is a linear regression fit to the data with a correlation coefficient of 0.956 (P= 0.011).