
Figure 7. Effect of increased hypotonic stress on P-gp ‘knock-down’ cells.
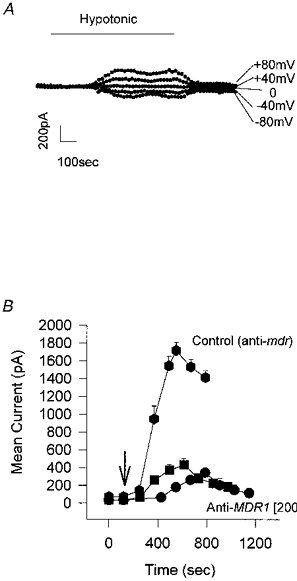
A, the whole-cell current in response to the voltage protocol of 0, ±40 and ±80 mV reaches a plateau following exposure to 23 % hypotonic solution. Cell incubated for 48 h in anti-MDR1 (200 μg ml−1). Increasing the exposure time (in this case to 13 min) did not increase the current elicited. Similar results were found in 3 experiments. B, effect of double exposure to hypotonic solution on the hypotonic-activated current. The mean current, elicited by a +80 mV step, is plotted as a function of time following exposure to hypotonic solution (↓) for cells that have been incubated for 48 h in lipofectin and antisense oligonucleotide to human MDR1 (•) or mouse mdr (♦), both at 200 μg ml−1. Following a 20 min wash, and complete recovery of the current to baseline levels, the cells were given a second exposure to hypotonic solution (▪). The data in anti-mouse mdr are given as a control. The peak current values in the figure are as follows: 200 μg ml−1 mouse mdr antisense oligonucleotide (control), 1716 ± 89 pA (n= 6); 200 μg ml−1 human MDR1 antisense oligonucleotide, first exposure to hypotonic solution, 386 ± 45 pA (n= 5), second exposure, 454 ± 84 pA (n= 5). The latency decreased from 255 ± 21 s (n= 5) following the first exposure to hypotonic solution to 125 ± 12 s (n= 5) following the second exposure. This latter value is not significantly different from the control value of 124 ± 29 s (n= 11; see Fig. 5).