
Figure 1. Effect of full metabolic inhibition on L-type Ca2+ current.
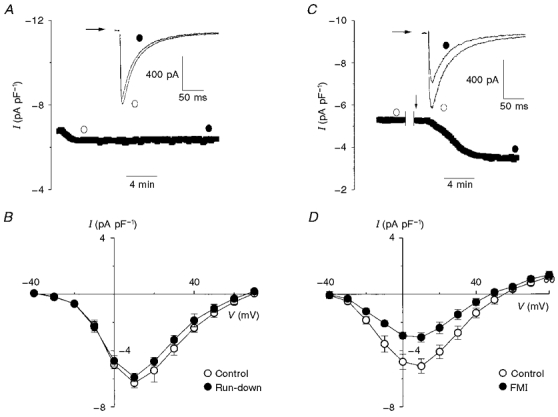
A, once the whole-cell configuration was achieved, ICa was sampled at 0.2 Hz and I-V relationships were recorded at the times indicated by the open and filled circles. The typical raw traces (inset) indicate that ICa run-down was minor over the 10 min sampling period. B, mean I-V relationships showing that sampling ICa at 0.2 Hz for 10 min did not significantly reduce ICa under our conditions (n= 4). C, ICa was sampled for 5 min before the indicated interruption in order to record a control I-V relationship. This was followed by external wash-in (arrow) of 2-deoxyglucose (10 mM) and sodium cyanide (2 mM) (full metabolic inhibition, FMI). The raw traces (inset) demonstrate that ICa prior to FMI (open circle) was larger than ICa after FMI (filled circle). D, mean I-V relationships which show that, on average, 10 min of FMI resulted in a 40 % reduction of ICa at +10 mV (n= 5, P < 0.01).