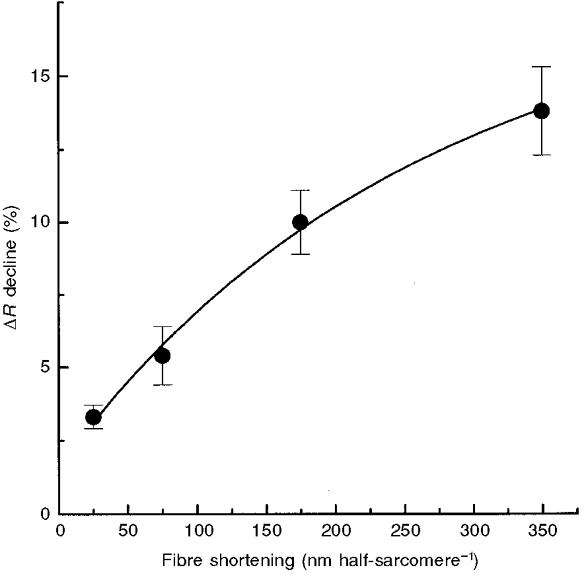
Figure 5. Relation between amplitude of fall in furaptra ΔR record and ramp amplitude in tetanized frog skeletal muscle fibres.

Plot of the decline in mean furaptra ΔR during the force regeneration phase of each release versus ramp amplitude for all fibres used in these experiments (means ±s.e.m., n= 6-10). The decline in mean furaptra ΔR is expressed as a percentage of mean tetanic fluorescence levels of control isometric contractions. All ΔR declines were significantly greater than zero (P < 0.05) and, with the exception of the two smallest ramps, significantly different from each other (P < 0.05).
