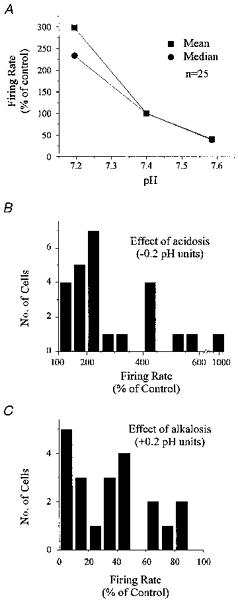
Figure 4. Summary of chemosensitivity of neurones stimulated by hypercapnic acidosis.

A, mean and median firing rate (percentage of control) are plotted against pH for 25 stimulated neurones exposed to at least six transitions in CO2. B, histogram of responses to hypercapnic acidosis of the same stimulated neurones as in A. Responses were normalized to a change in pH of −0.2 units. Most neurones increased their firing rate to more than 200% of control when CO2 was increased from 5% to 9%. C, histogram of responses to hypocapnic alkalosis of the same stimulated neurones as in A. Responses were normalized to a change in pH of +0.2 units. Most neurones decreased their firing rate to below 50% of control when CO2 was decreased from 5% to 3%.
