
Figure 1. Effect of TRH-R activation on HERG tail current kinetics.
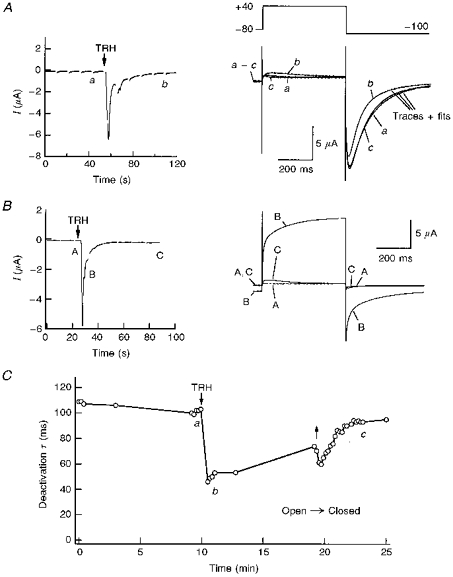
A, left, inward Ca2+-dependent Cl− currents in response to TRH. Representative inward Cl− currents in a voltage-clamped oocyte 2 days after co-injection of TRH-R and HERG channel cRNA are shown. The start of perfusion with high-K+ OR-2 plus 1 μM TRH is indicated. The current trace represents continuous segments obtained at −80 mV. The gaps on the trace indicate times at which a depolarization pulse was applied according to the voltage pulse diagram shown on the right. Right, membrane currents elicited by membrane depolarization at different times before (trace a) and after challenging the cell with TRH (traces b and c). Depolarization steps of 400 ms from −80 to +40 mV were delivered to the oocyte every 10 s, followed by a 400 ms repolarization to −100 mV. Membrane currents shown correspond to pulses delivered either 10 s before TRH addition (trace a), or 50 s after starting perfusion with 1 μM TRH (trace b), respectively. A current trace elicited with an identical protocol after 6 min of TRH washout (trace c) is also shown to illustrate the reversibility of the TRH effect. The TRH application lasted for about 9 min. Bi-exponential fits superimposed to the current traces are shown for −100 mV tails. Note the correspondence of current kinetics along the tail rising phase for control and TRH traces. B, left, inward Ca2+-dependent Cl− currents obtained in an oocyte injected with TRH-R cRNA but not with HERG channel messages. Right, membrane currents elicited by membrane depolarizations at the times marked A to C on the left. Identical conditions to those indicated in A were used. Note the fast monoexponential decay of the Cl− tail currents and their small magnitude 1 min after start of the TRH addition. C, time course of deactivation time constant variations in response to TRH. The time constant was quantified by fitting a double exponential to the tail as shown in A (right). Subsequently, the plotted deactivation time constant and the time constant for inactivation recovery were obtained from the decaying portion and the initial rising phase of the tail, respectively. The periods without data points correspond to times at which I-V curves were generated. Time constant values for the two pulses following introduction of TRH in the chamber, corresponding to periods of huge increases in inward Cl− currents, have not been included in the graph. Start of perfusion with 1 μM TRH and hormone washout is signalled by arrows. a-c correspond to the experimental times at which current traces marked with the same lettering in A were obtained.