
Figure 3. Effect of TRH on HERG channel voltage dependence of activation.
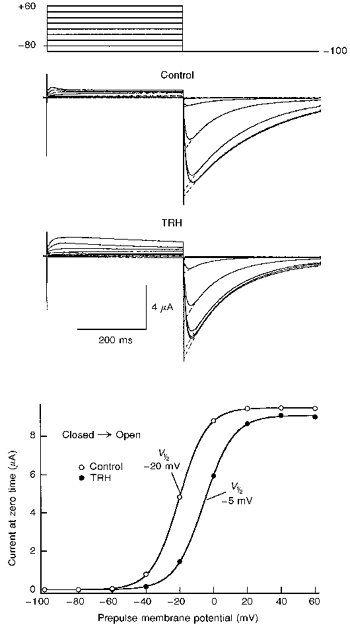
Voltage dependence of activation was studied in the absence (control) or the presence of 1 μM TRH by varying the magnitude of a 400 ms prepulse according to the voltage protocol shown at the top. Test pulses were applied once every 20 s. When the effect of TRH was tested, data collection started 2 min after challenging the cell with the neuropeptide. The magnitude of the instantaneous tail current at −100 mV was determined by fitting an exponential to the decaying portion of the tail as shown superimposed on the tail currents, and extrapolating the current to the moment the depolarizing pulse was ended. The continuous lines in the lower panel correspond to Boltzmann curves: h (V) =Imax (1/(1 + exp (V - V½)/k)), which best fitted to the data with V½ of −20 and −5 mV, Imax of 9.4 and 9.1 μA, and k values of −8.1 and −8.7 for control and TRH, respectively.