
Figure 3. Effect of dibutyryl cAMP on [Ca2+]i in rat melanotrophs.
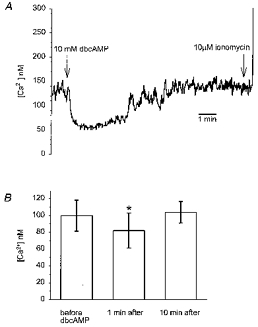
A, time course of the effect of dibutyryl cAMP (dbcAMP) on [Ca2+]i in a single rat melanotroph. The points of application of dbcAMP and ionomycin as concentrated boluses are indicated by the arrows (10 μl of 0.4 M dbcAMP was added to 0.4 ml of bath solution to raise the concentration to 10 mM. A 10 μm concentration of ionomycin in the bath was similarly achieved by adding 0.8 ml of 5 mM ionomycin). B, histograms of [Ca2+]i before, 1 min and 10 min after dbcAMP application. The data are the means ±s.e.m. for 32 cells. *P < 0.002 (Student's paired t test), significantly different to control data obtained before dbcAMP addition.