
Figure 4. Amplification of discrete capacitance steps by dipicrylamine (DPA) and the effect of intracellular cAMP-ATP.
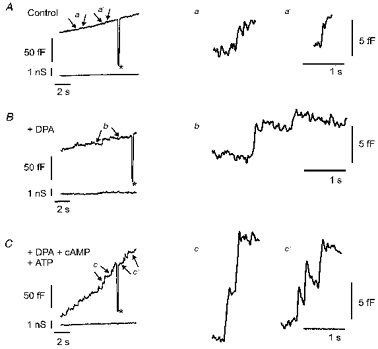
A, epoch of a recording of Cm as a function of time in a cell not treated with DPA. The standard patch pipette solution (see Methods) contained 0.45 μm Ca2+. B, time-dependent changes in Cm from a cell dialysed with standard intracellular solution but pretreated with DPA (2 min, 10 μm). C, time course of Cm in a DPA-pretreated cell dialysed with a standard internal solution containing 0.2 mM cAMP and 1 mM ATP. The asterisks in A, B and C indicate the addition of a 100 fF capacitance calibration signal, which shows that there was no cross-talk between the capacitance and conductance signals (lower traces in A, B and C; see Zorec et al. 1991; Zupancic et al. 1994). The epochs of records marked by arrows (a, a' in A, b in B and c, c' in C) are expanded on the right side of the figure to indicate the relative amplitudes of the capacitance steps. The size of the steps in B is almost twice that shown in A. The resting Cm values for the cells shown in A, B and C were 5.1, 6.7 and 6.7 pF, respectively. Holding potential, -55 mV. Traces were low-pass filtered (30 Hz, -3 dB, Bessel 4-pole).