
Figure 5. Amplitude of capacitance steps measured in DPA-pretreated cells dialysed with standard pipette solution (control) or cAMP-ATP.
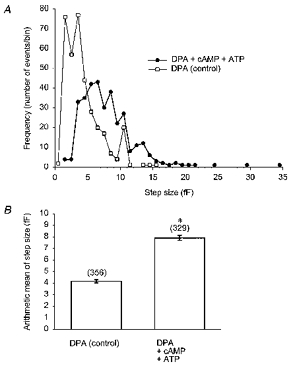
A, amplitude histogram (frequency polygon) of capacitance steps denoting unitary exocytic steps in control cells (□) and in the presence of cAMP-ATP (0.2 mM, 1 mM; •). The bin width used for the histogram was 1 fF. B, bar chart showing the mean step size (error bars denote ±s.e.m.) of capacitance steps in control cells and significant increase (*P < 0.001) in the presence of cAMP-ATP. The data from A and B are from experiments performed at a holding potential of -55 mV.