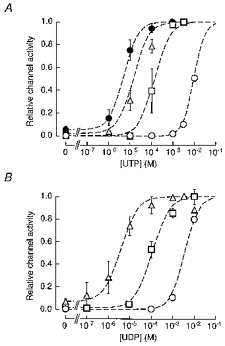
Figure 6. Activation of SUR2B/Kir6.1 channels by UTP, UDP and pinacidil.

Data are reproduced from Fig. 2C b for UTP (A) and from Fig. 3B b for UDP (B). The dashed lines represent the fits of these data to eqn (6) which represents the increase in channel activity resulting from the recruitment of ion channels (see text for details).
