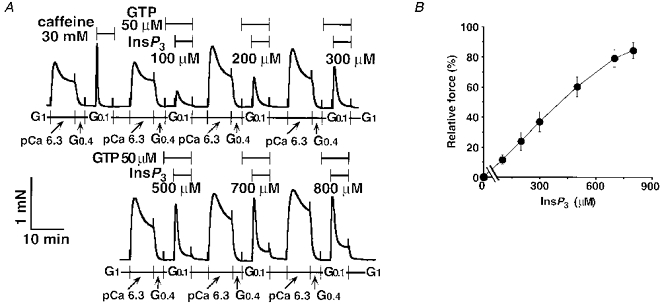
Figure 4. InsP3-induced contraction in α-toxin-permeabilized tracheal SM.

After the 30 mM caffeine response, InsP3 at a range of 100–800 μm with 50 μm GTP was added to the same strip repeatedly (A). The dose-response relationship for InsP3 was determined using six strips. Data are expressed as means ±s.e.m. (n = 6, B).
