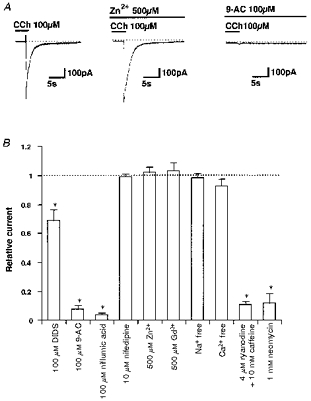
Figure 4. Pharmacological profile of ICCh.

A, examples of actual traces. Zn2+ (500 μm) was added shortly before application of CCh, as it blocks cation channels almost immediately. In contrast, the inhibitory effects of 100 μm 9-AC on ICCh take much longer to develop and so 9-AC was applied > 20 min before CCh. B, summary of inhibition by various blockers. Vertical axis shows the amplitude of ICCh in the presence of the blockers normalized to their controls. Note that the values for DIDS, 9-AC and niflumic acid were obtained 20–30 min after the start of application to confirm their maximal effects. The data in Ca2+-free solution (0.1 mM EGTA) were obtained 5 min after its introduction. Repeated activation of ICCh in Ca2+-free solution resulted in a gradual decline in amplitude (not shown). Asterisks indicate significant differences with Student's paired t test (P < 0.005).
