
Figure 2. La3+ pre-perfusion prolongs GABA current deactivation in α1β3γ2-transfected cells.
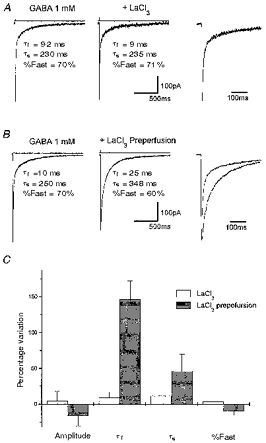
A, averaged response induced by 2 ms applications of 1 mM GABA and 1 mM GABA + 100 μm LaCl3 in a lifted small cell transfected with α1β3γ2 cDNAs. Also shown is the biexponential fitting to the current decay with an indication of the fitting parameters. The traces are shown superimposed in the right panel. B, averaged response in another lifted small cell transfected with α1β3γ2 cDNAs induced by 2 ms application of 1 mM GABA and 1 mM GABA + 100 μm LaCl3. Applications of GABA + LaCl3 were preceded by perfusion with LaCl3 (100 μm). Holding potential, -60 mV. Prolongation of the current decay can be better observed in the right panel where the traces are shown superimposed. Above each trace are shown the currents generated by the liquid junction potential due to a 50:1 dilution of the GABA-containing solution measured after ‘blowing out’ the patch, to give an indication of the duration of the pulse application. Calibration bars apply to A and B, but not to the current pulse. C, summary of the kinetic analysis of the LaCl3 effects on responses to 2 ms GABA applications. τf and τs, deactivation time constants; %Fast, percentage contribution of the fast component of biexponential functions fitted to the current decay. Each bar represents the mean ±s.e.m. of 18 patches studied.