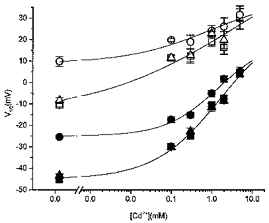
Figure 5. Interaction of acidosis and Cd2+ in rat myocytes.

Concentration dependence of the effect of Cd2+ on the V½ of activation (open symbols) or inactivation (filled symbols) in control (squares), acidosis (circles) and second control (triangles). With increasing Cd2+ concentration, the V½ of both activation and inactivation was shifted to more positive potentials. The effect of acidosis consisted of a further shift of V½ to a more positive value but the magnitude of this additional shift decreased with increasing Cd2+ concentration. At 5 mM Cd2+ acidosis failed to induce a further shift. The values at 0 mM Cd2+ were obtained with nisoldipine as the ICa,L blocker. Different Cd2+ concentrations were applied in different groups of cells; n varied between 3 and 8. Data points were fitted by eye (continuous lines).
