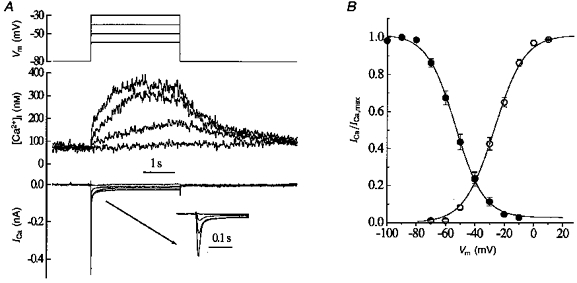
Figure 1. The threshold voltage of depolarization for the depolarization-activated Ca2+ entry in uterine myocytes.

A, traces show (from top to bottom): membrane potential (Vm), [Ca2+]i and membrane current (ICa). The inset shows the current records on an expanded time scale. B, steady-state inactivation (•) and activation (○) of ICa as a function of membrane potential. The continuous lines were obtained by fitting Boltzmann equations to the experimental data. Half-inactivation occurred at -53 mV with a slope factor of 9.9 mV. The potential for half-activation was -27 mV, with a slope factor of 11 mV. Error bars are s.e.m. (n = 6).
