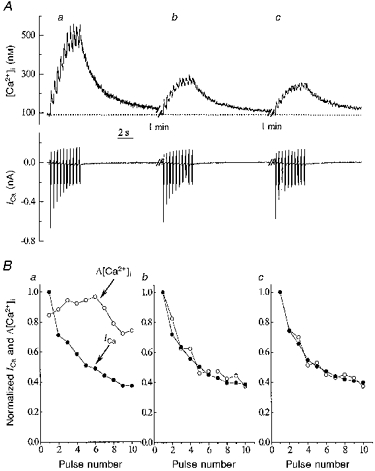
Figure 3. Effects of repetitive stimulation on [Ca2+]i.

A, traces show: top, [Ca2+]i; bottom, ICa. During the periods of stimulation (shown by the spikes in the current record) 100 ms duration depolarizing pulses were applied from a holding potential of -80 to 0 mV at 3 Hz. B, changes in ICa and Δ[Ca2+]i during repetitive stimulation. ICa was normalized to the value of the first ICa in the burst. [Ca2+]i transients were normalized to the maximal Δ[Ca2+]i occurring during the train of voltage steps. Graphs labelled a-c correspond to transients a-c shown in A.
