
Figure 1. Scheme depicting the method for quantifying oxidative phosphorylation and estimating contractile costs during aerobic stimulation.
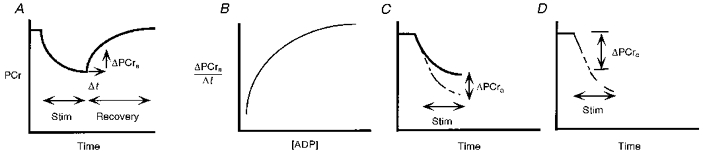
A, PCr dynamics during recovery following stimulation measures phosphorylation rate (ΔPCra/Δt). B, phosphorylation rate vs.[ADP]. C, subtraction of PCr synthesis from that measured (PCre) to yield PCr level in absence of aerobic synthesis (PCre-a). D, the initial slope of PCre-avs. time measures contractile cost (ΔPCrc).