
Figure 5. Partitioning of the extent of PCr synthesis as a function of time during the aerobic (filled symbols) and ischaemic (open symbols) stimulation periods.
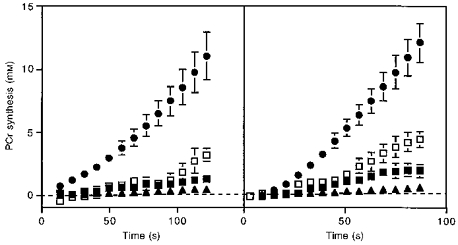
Oxidative phosphorylation (eqn (2), •); proton generation (eqn (5); aerobic (▪) and ischaemic (□) stimulation) for wrist flexors (left panel) and ankle dorsiflexors (right panel); and glycolytic flux that is oxidized under aerobic conditions (eqn (6), ▴) assuming 50 % of the substrate used by oxidative phosphorylation is pyruvate. Values, bars and sample sizes as in Fig. 4.