
Figure 6. The extent of glycolytic PCr synthesis as a function of the number of stimulations during aerobic (▪) and ischaemic (□) stimulation periods.
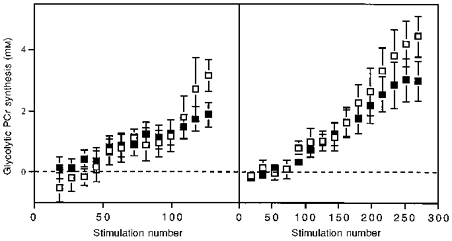
Wrist flexors, left panel; ankle dorsiflexors, right panel. Values, bars and sample sizes as in Fig. 4.