
Figure 4. The relationship between extracellular cation levels, the intracellular Ca2+ concentration and responses to carbachol (CCh).
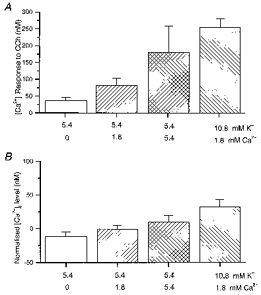
A, mean calibrated change in [Ca2+]i on exposure to carbachol (10 μm; 90 s) for a range of extracellular Ca2+ and K+ concentrations. B, normalized intracellular Ca2+ level (relative to that in 5.4 mM K+, 1.8 mM Ca2+) at the time of the carbachol exposure under the various conditions. Pooled data were obtained from experiments where carbachol was applied under at least 2 separate conditions, without prior depolarization, and includes all cells that were responsive to carbachol.