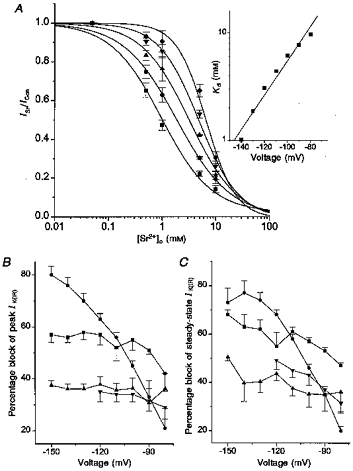
Figure 7. EC50 values for block of IK(IR) by Sr2+ over a range of test potentials (−140 to −100 mV).

A, fractional inhibition of peak inward current vs. external Sr2+ concentration at −140 mV (▪), −130 mV (•), −120 mV (▴), −110 mV (▾) and −100 mV (♦). ICon is the peak current in standard bath solution and ISr is the current in the presence of 0.05–10 mm Sr2+. The voltage dependence of the Sr2+ block was well fitted by the logistic equation. The inset shows a plot of EC50 values vs. test potential for the same cells. The data points were well fitted with a linear regression yielding a slope such that an e-fold change in EC50 occurs over a 27 mV range. B, percentage block of peak IK(IR)vs. the test potentials for 10 mm Ca2+ (▪), 5 mm Mg2+ (▴), 5 mm Mn2+ (▾) and 5 mm Sr2+ (•). C, percentage block of steady-state IK(IR) by 10 mm Ca2+ (▪), 5 mm Mg2+ (▴), 5 mm Mn2+ (▾) and 5 mm Sr2+ (•) for the various test potentials shown.
