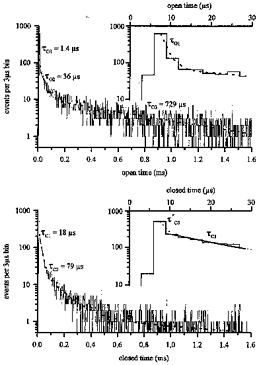
Figure 3. Distributions of open times and closed times for one experiment with 10μm ACh.

Insets show the first ten bins. The open time distribution contains three exponential components with the time constants or mean durations τO1= 1.4μs, τO2= 36μs and τO3= 729μs. τO1 represents by far the largest component of the distribution, containing 0.94 of the total area. The closed times present the components τC1= 18μs and τC2= 79μs; further components are much longer and depend on the number of channels present in the patch. Again the shortest component τC1 is the largest, containing 0.51 of the area, while τC2 amounts to 0.21. As shown in the inset this fit (thick line) starts only from the fourth bin, 9–12μs. Although closings longer than 6μs should have been resolved, the third bin was not included in the fit, because solely its amplitude deviates from the 18μs fit. If the third bin is included, a first short component τ′C0= 1.05μs is found (dotted line).
