
Figure 4. Correlations of closed times (ordinates) with the following open time (abscissae) from idealized traces as in Fig. 2C.
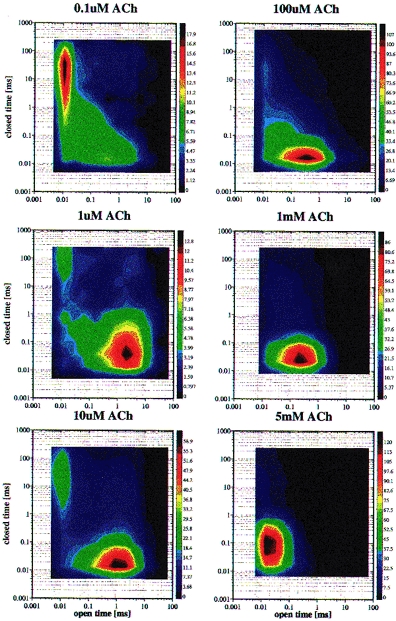
The square root of the number of events per log-bin is represented by the colour code at the right. In the left panel the ACh concentration rises from 0.1 to 10μm. At 0.1μm ACh, there is one peak containing open times around 10μs and multiple relatively long closed times. With increasing ACh concentrations, this peak becomes weaker and a peak around 1 ms open time and 20μs closed times grows. The first peak represents τO1, short single openings of singly liganded receptors, while the second peak is generated by burst of 800μs openings (τO3) with 16μs closings (τC1) of the doubly liganded receptors. In the right panel with 0.1–5 mm ACh, the ‘burst’ peak shifts more and more towards shorter open times; the 800μs openings are interrupted by 18μs closings due to binding of ACh to open channels (see Fig. 2B). With 5 mm ACh the peak extends to closed times of 400μs, indicating a second, longer component of open channel block.