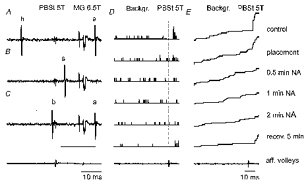
Figure 2. Examples of records from an MG γ-motoneurone and the effects of NA.

A-C, three sequences (single traces) of extracellular records; a, antidromically evoked responses of the tested γ-motoneurone following 6.5T stimulation of the medial gastrocnemius nerve, preceded by stimulus shock artifacts and antidromic field potentials in the MG motor nucleus; b, spontaneously occurring background discharges; and s, a synaptically evoked response following 5T stimulation (single stimulus) of the PBST nerve. Note that the neurone was antidromically activated in A and C but not in B, where the antidromic response collided with a synaptically evoked spike potential appearing at an interval close to the critical collision interval (indicated by a thin horizontal line in C). D and E, histograms of responses recorded during 25 successive trials and cumulative sums of the same responses. The responses were recorded before (control) and after placement of an NA-containing micropipette and during NA ionophoresis; the duration of ionophoresis is indicated to the right. Vertical lines separate spike potentials preceding and following stimulation of the PBST nerve. The lowermost records in the three columns are from the cord dorsum and show afferent volleys following stimulation of peripheral nerves. Note that the time base in A-C is twice as fast than in D and E. In this and the following figures the negativity in the microelectrode records is downwards and in records from the cord dorsum upwards. The intensity of the stimuli is indicated in multiples of thresholds for the most sensitive fibres in a given nerve.
