
Figure 3. Changes in the number of responses of γ-motoneurones during and after NA and tizanidine ionophoresis.
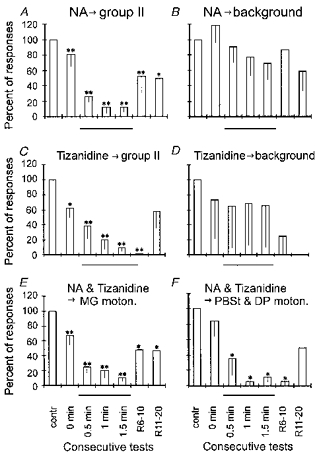
In all plots the numbers of action potentials following stimulation of group II afferents (A, C, E and F) or preceding it (i.e. background discharges: B and D) are compared before, during and after ionophoresis of NA and tizanidine. Responses evoked by group II afferents were sampled within 5–10 ms time windows and the background discharges within 25–100 ms time windows preceding stimulation of peripheral nerves. A and B are for responses of 9 and 7 γ-motoneurones, respectively, tested for the effects of NA. C and D contain similar data for the effects of tizanidine on 8 and 5 γ-motoneurones, respectively. E and F are for 11 MG γ-motoneurones (E) and 6 PBST and DP γ-motoneurones (F) on which effects of either NA or tizanidine were tested. The plots show means and s.e.m. s of the numbers of action potentials recorded during 25 successive trials, expressed as a percentage of the number under control conditions. The comparison involves responses evoked by group II afferents or background discharges appearing after the placement of the drug-containing pipette (0 min, with the retaining current), during ionophoresis (0.5, 1.0 and 1.5 min) and during recovery (R6–10 min, R11–20 min, with the retaining current). Student's t test and Wilcoxon's test for matched pairs (one tailed) were used to evaluate the statistical significance of the differences (*P= 0.01–0.05; **P < 0.01). Thin lines below abscissa indicate the data obtained during ionophoresis.