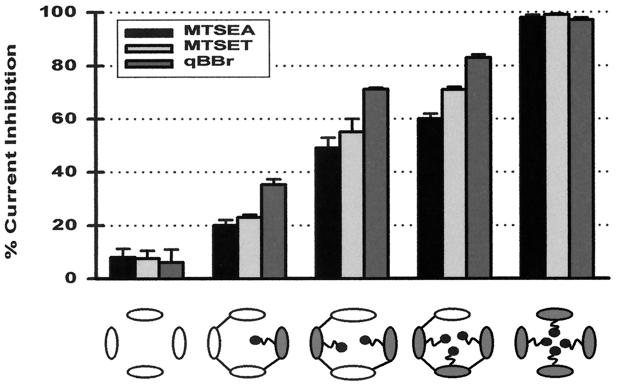
Figure 5.
Sizing the intracellular vestibule by using stoichiometric covalent modification. The bar graph illustrates the steady-state inhibition of current at −80 mV by MTSEA, MTSET, and qBBr in channels containing zero to four E224C subunits. The channel type is depicted by the schematic underneath the bar graph, with open ovals representing the control IRK1J subunit and filled ovals representing the E224C subunit. Current was elicited in giant inside-out patches by voltage ramps from −100 mV to +80 mV over 70 ms from a holding potential of −40 mV. Percentage inhibition was calculated from the current at −80 mV before application and after washout of a modifying reagent. Steady-state inhibition in the five types of channels was 8.0 ± 3.2%, 20 ± 2%, 44 ± 1%, 60 ± 2%, and 98% by 2.5 mM MTSEA, 7.5 ± 3%, 23 ± 1%, 55 ± 5%, 71 ± 1%, and 99% by 2 mM MTSET, and 6 ± 5%, 35.3 ± 2.1%, 71.7 ± 0.6%, 83 ± 1.1%, and 97 ± 1.0% by 4 mM qBBr. For MTSET and qBBr, steady-state modification was confirmed by the lack of further inhibition upon subsequent application of 2.5 mM MTSEA.

