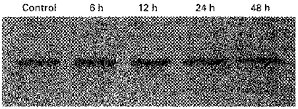
Figure 5. Effect of chronic hypoxia on Gsα protein levels in PC12 cells.

Profiles of Gsα-subunit protein during exposure to hypoxia. Cells were harvested at the indicated time points after exposure to 10 % O2 and proteins were analysed by immunoblot analysis. A representative immunoblot is shown from a total of n = 4 dishes in each group performed in a single experiment.
