
Figure 2. Neuronal signals recorded from Purkinje cells at a depth of 300 μm with a glass microelectrode.
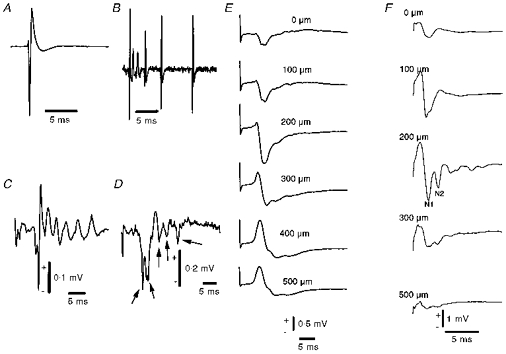
A, spontaneous simple spike (average of 15 spikes). B, spontaneous complex spike, which is characterized by a variable waveform. C, averaged complex spike (average of 10 sweeps) evoked by climbing fibre stimulation. Neuronal signals in A, B and C were recorded with a bandpass filter of 0.3–5 kHz, emphasizing fast components of sodium spikes and the early part of the climbing fibre response. The vertical bar in C indicates 0.1 mV for A, B and C. D, single evoked field potential recorded under the same conditions as in C, but with a filter that allows passage of the slow component of the signal (0.5 Hz to 3 kHz). Sodium spikes are seen as small volleys indicated by arrows. E, laminar analysis of field potentials in response to climbing fibre stimulation. The potential shown is an average of 100 sweeps of the signal shown in D. The depth profile shows a characteristic source-sink profile with a net positive current passing into the cell at the top of the molecular layer giving rise to a negative extracellular potential, with potential reversal at 300–500 μm, corresponding to the Purkinje cell body layer. F, laminar analysis of field potentials in response to parallel fibre stimulation. The parallel fibre response consisted of a presynaptic component (N1) due to action potentials in the fibres, and a postsynaptic component (N2) due to activation of AMPA receptors. The parallel fibre response was largest close to the cerebellar surface and decreased as a function of depth.