
Figure 4. AP6A fails to activate IK(ACh).
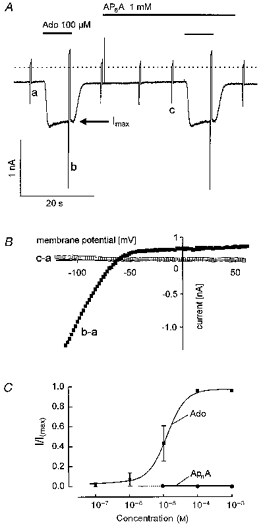
A continuous recording of membrane current at −90 mV holding potential. Ado (100 μm) and AP6A were applied as indicated. Rapid deflections represent changes in membrane current (I–V relations) caused by voltage ramps from −120 mV to +60 mV. The dotted line in this and subsequent figures denotes zero current level. B, difference I–V relations obtained by subtraction of the curves labelled in A. Curve labelled b - a represents the Ado-activated current, whereas c - a, yielding a straight line at 0 pA, indicates that AP6A had no effect on the background I–V relation. C, concentration- response curve for Ado (▪) and APnA (•). Mean values ± s.d. have been plotted against concentration. Currents have been normalized to Imax, the current evoked by either 100 μm or 1 mm Ado at the end of the fast desensitizing component, marked by the arrow in A (n = 4 to 9 for each concentration of the two compounds).