
Figure 5. Inhibition of IK(ACh) and activation of a weakly inward rectifying current by AP6A.
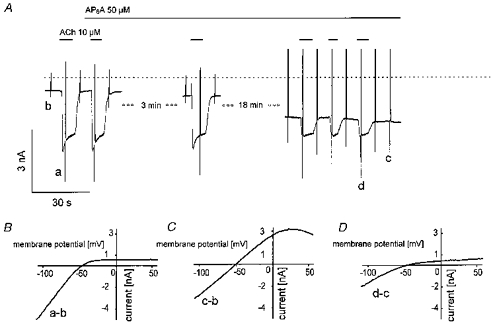
Sections of membrane current recordings at −90 mV holding potential with superimposed voltage ramps (A). Large ramp-induced peak currents at this time resolution were sometimes graphically truncated or distorted by reduction of data points in the graphics files and thus do not always represent true currents. ACh (10 μm) and AP6A (50 μm) were applied as indicated. B-D, difference I–V curves obtained by subtraction of voltage ramp-induced currents corresponding to the labelling in A (B, ACh-induced current; C, AP6A-induced current; D, fraction of ACh-induced current inhibited by AP6A).