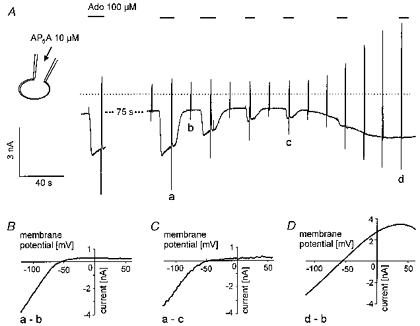
Figure 8. Inhibition of IK(ACh) and activation of IK(ATP) by intracellular AP5A.

A, recording of membrane current as in previous figures. Ado (100 μm) was applied as indicated. Pipette filling solution was supplemented with 10 μm AP5A at standard [ATP]i of 2 mm. B-D, difference I–V curves of Ado-activated (control) IK(ACh) (B), inhibited IK(ACh) (C) and current activated by intracellular AP5A (D). Letters correspond to those in A.
