
Figure 2. Pressure response (from Fig. 1) after ganglionic blockade at higher temporal resolution.
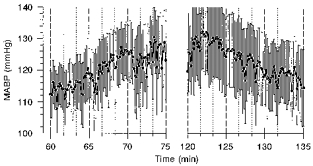
The first 15 min of the rise of MABP during reduction of RABP (left) and the first 15 min of the fall of MABP after release of the cuff (right) are shown in 4 dogs during ganglionic blockade. •, mean values averaged over 10 s (± s.e.m.). Vertical lines denote periods of 100 s.