
Figure 5. Changes of integrated spectral density and standard deviation of blood pressure below 0.002 Hz induced by ACE inhibition.
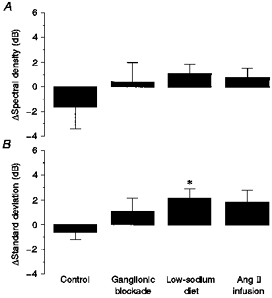
The columns depict average changes induced by ACE inhibition under control conditions (n = 7) ganglionic blockade (n = 7), low-sodium diet (n = 7) and Ang II infusion (n = 7). A, changes in spectral density of blood pressure integrated between 0.0002 and 0.002 Hz. B, changes in the standard deviation of blood pressure calculated from consecutive 8.3 min mean values of MABP. Data are presented as means ± s.e.m. *P < 0.05.