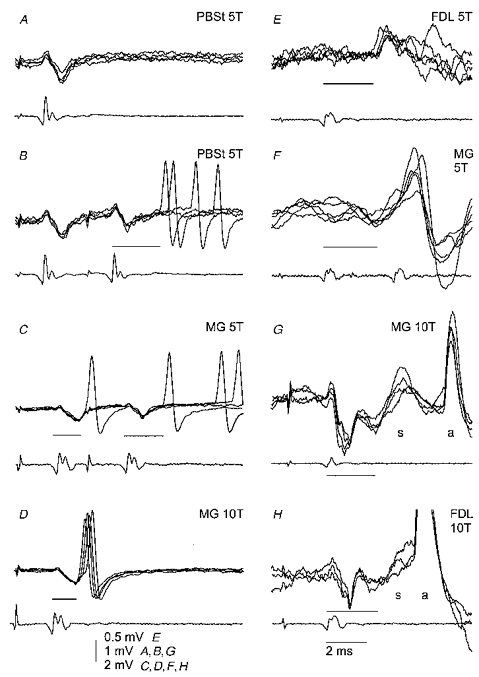
Figure 2. Examples of records used to determine the shortest latency of the responses.

In each pair of records the top ones are 3 or 5 superimposed records from γ-motoneurones (just before penetration in A-D, intracellular in E-H), and the bottom records are from the surface of the spinal cord. In A and B, records from an MG motoneurone illustrate the situation when responses evoked by the second stimulus were used for measurements since there was no response to one stimulus. In C and D, records from another MG motoneurone (the same cell as in Fig. 1) illustrate that with an increase in stimulus intensity (from 5 to 10T) responses to the first stimulus appeared more regularly, and their latencies became shorter. In E and F, records from two MG motoneurones illustrate the occurrence of both early and later postsynaptic potentials evoked by the stimulated afferents. In G and H, records from two motoneurones (MG and FDL motoneurones) illustrate EPSPs (labelled s) evoked in homonymous γ-motoneurones by stimuli suprathreshold for their antidromic activation and therefore followed by blocked antidromic spikes (labelled a). The minimal latencies of the responses in each panel are indicated by thin lines. Other indications are as in Fig. 1.
