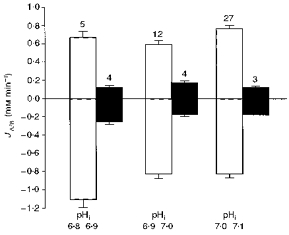
Figure 3. Sodium-dependent acid/base flux rates.

The rate of acid/base flux (JA/B) at different ranges of intracellular pH values in the presence (□, control) and in the absence of external sodium (▪, 0 mm Na+) as measured by changes in the intracellular pH in response to altering the external pH. The figures above the standard deviation bars give the number of experiments.
