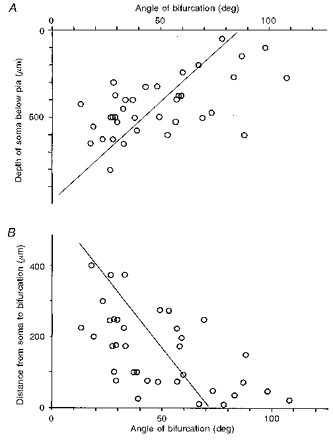
Figure 8. Measurement of the bifurcation angle.

A, correlation between the subpial somal depth of neurones and the bifurcation angle of the apical dendrite. r =−0.58, P < 0.001 (n = 36). Regression line was drawn with the depth as the independent variable. B, correlation between the distance from the soma of the bifurcation and the angle of bifurcation. r =−0.56, P < 0.001 (n = 36). Regression line was drawn with the distance as the independent variable.
