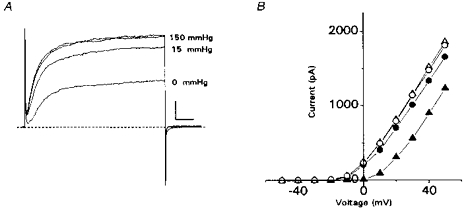
Figure 1. PO2-dependent suppression of outward current in neonatal rat adrenal chromaffin cells (AMC).

A, leak-unsubtracted outward currents recorded from a cell exposed sequentially to normoxia (PO2 = 150 mmHg), hypoxia (PO2∼15 mmHg), normoxia again (not shown), anoxia (PO2 = 0 mmHg) and finally normoxia (wash). All traces were obtained during voltage steps from −60 to +30 mV, and each trace is the average of 4 records; the 2 top traces are superimposed initial (control) and final (wash) recordings in normoxia. Horizontal scale represents 10 ms and vertical scale 200 pA. B, current vs. voltage plots for the cell in A. Records were taken at 10 mV voltage increments from a holding potential of −60 mV. Symbols are as follows: control, ○; hypoxia, •; anoxia, ▴; wash, ▵. The anoxic stimulus was applied after the cell had recovered from the hypoxic stimulus (not shown). Wash represents recovery after anoxia. Note the magnitude of outward current suppression is PO2 dependent. Similar results were obtained in 4 other cells exposed to normoxia, hypoxia and anoxia.
