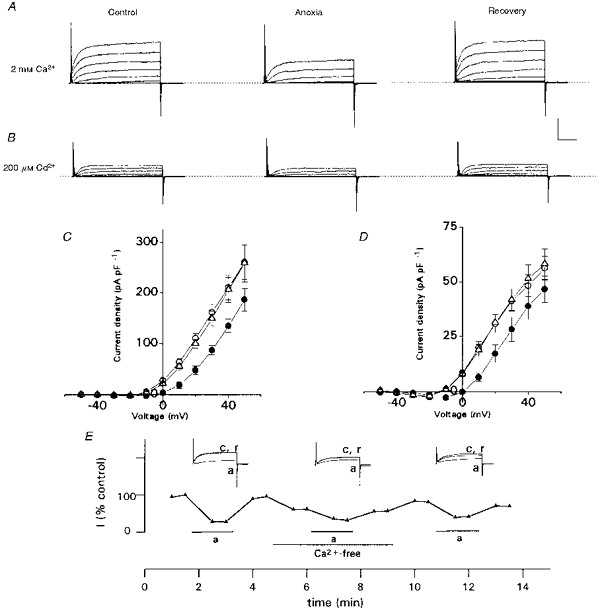
Figure 2. Effect of anoxia on Ca2+-dependent and Ca2+-independent outward currents in neonatal rat AMC.

A, leak-unsubtracted outward current traces recorded from a cell in normal (2 mm) Ca2+, before (left; control), during (middle) and after (right; recovery) exposure to anoxia. Traces shown are for voltage steps from a holding potential of −60 to +50 mV in 10 mV increments; the top trace in each record represents the step to +50 mV. Note anoxia reversibly suppresses outward current. B, the same cell (as in A) exposed to a similar protocol, except that Ca2+-dependent currents were blocked by inclusion of 200 μm Cd2+ in the bathing solution. Note anoxia still had a suppressive effect on the residual Ca2+-independent outward current. In A and B, the vertical scale represents 500 pA and horizontal scale represents 10 ms. C and D, current density vs. voltage plots for 10 representative cells, including the one in A. Mean current density (± s.e.m.) is shown for cells recorded in 2 mm Ca2+ (C) and 200 μm Cd2+ (D). The current density measured during anoxia was significantly different from control (P < 0.05) at all voltage steps between −10 and +50 mV in C, or −10 and +30 mV in D, and recovery was complete at each step. Control, ○; anoxia, •; recovery, ▵. E, time course of anoxic inhibition of outward currents (step to +40 mV) in the presence and absence (Ca2+-free) of extracellular Ca2+. Note that the cell responded to a third anoxic stimulus after return to normal Ca2+-containing medium. Outward current is expressed as a percentage of the maximum recorded in normal Ca2+. c, a and r refer to control, anoxia and recovery, respectively.
